


Page 37 - Demo
P. 37
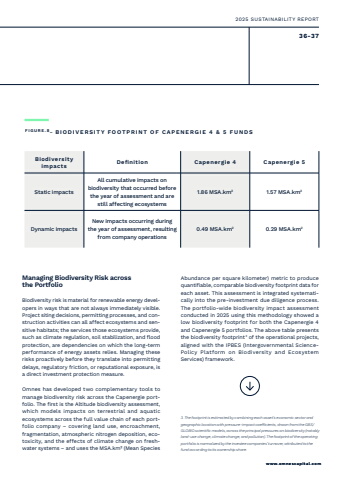
36-372025 SUSTAINABILITY REPORTwww.omnescapital.com www.omnescapital.com3. The footprint is estimated by combining each asset%u2019s economic sector and geographic location with pressure-impact coefficients, drawn from the GBS/GLOBIO scientific models, across the principal pressures on biodiversity (notably land-use change, climate change, and pollution). The footprint of the operating portfolio is normalized by the investee companies%u2019 turnover, attributed to the fund according to its ownership share.Biodiversity impacts Definition Capenergie 4 Capenergie 5Static impactsAll cumulative impacts on biodiversity that occurred before the year of assessment and are still affecting ecosystems1.86 MSA.km2 1.57 MSA.km2Dynamic impactsNew impacts occurring during the year of assessment, resulting from company operations0.49 MSA.km2 0.29 MSA.km2Managing Biodiversity Risk across the PortfolioBiodiversity risk is material for renewable energy developers in ways that are not always immediately visible. Project siting decisions, permitting processes, and construction activities can all affect ecosystems and sensitive habitats; the services those ecosystems provide, such as climate regulation, soil stabilization, and flood protection, are dependencies on which the long-term performance of energy assets relies. Managing these risks proactively before they translate into permitting delays, regulatory friction, or reputational exposure, is a direct investment protection measure.Omnes has developed two complementary tools to manage biodiversity risk across the Capenergie portfolio. The first is the Altitude biodiversity assessment, which models impacts on terrestrial and aquatic ecosystems across the full value chain of each portfolio company %u2013 covering land use, encroachment, fragmentation, atmospheric nitrogen deposition, ecotoxicity, and the effects of climate change on freshwater systems %u2013 and uses the MSA.km%u00b2 (Mean Species Abundance per square kilometer) metric to produce quantifiable, comparable biodiversity footprint data for each asset. This assessment is integrated systematically into the pre-investment due diligence process. The portfolio-wide biodiversity impact assessment conducted in 2025 using this methodology showed a low biodiversity footprint for both the Capenergie 4 and Capenergie 5 portfolios. The above table presents the biodiversity footprint3 of the operational projects, aligned with the IPBES (Intergovernmental SciencePolicy Platform on Biodiversity and Ecosystem Services) framework.FIGURE.8_ BIODIVERSITY FOOTPRINT OF CAPENERGIE 4 & 5 FUNDS


